Financial Highlights
| 2017 | 2018 | 2019 | |
|---|---|---|---|
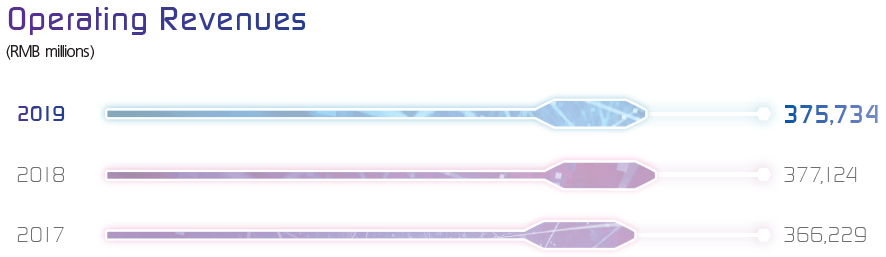
| Operating revenues (RMB millions) | 366,229 | 377,124 | 375,734 |
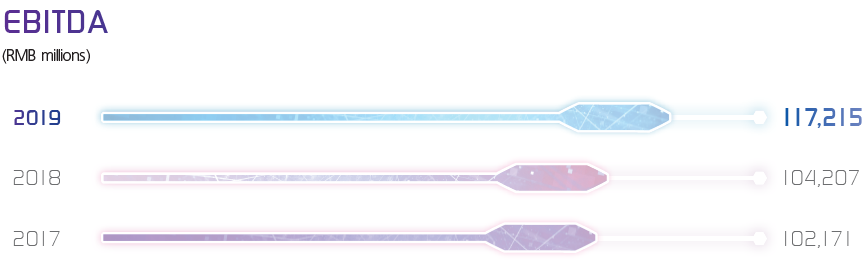
| EBITDA1 (RMB millions) | 102,171 | 104,207 | 117,215 |
| EBITDA margin2 | 30.9% | 29.7% | 32.8% |
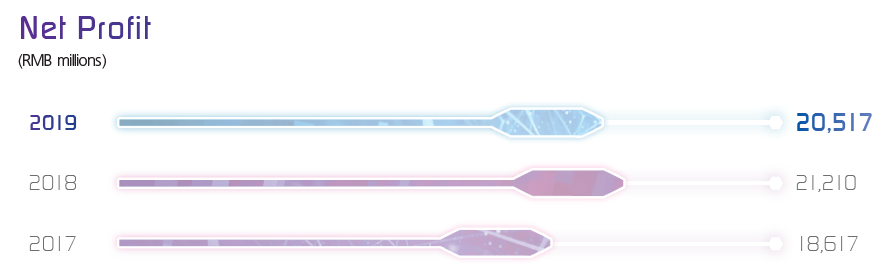
| Net profit3 (RMB millions) | 18,617 | 21,210 | 20,517 |
| Capital expenditure (RMB millions) | 88,712 | 74,940 | 77,557 |
| Free cash flow4 (RMB millions) | 7,267 | 22,457 | 21,725 |
| Total debt/Equity5 | 32.0% | 27.9% | 22.4% |
| Earnings per share (RMB) | 0.2300 | 0.2621 | 0.2535 |
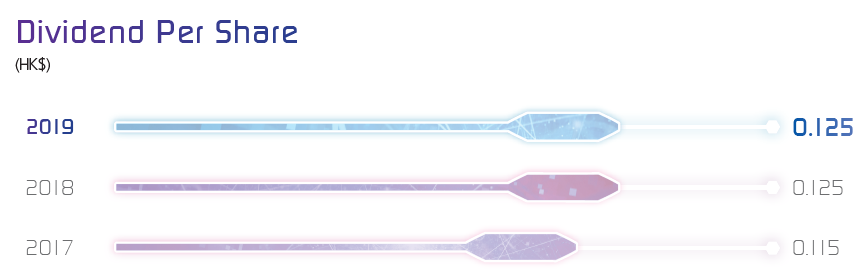
| Dividend per share (HK$) | 0.115 | 0.125 | 0.125 |
- EBITDA is calculated based on operating revenues minus operating expenses plus depreciation and amortisation.
- EBITDA margin is calculated based on EBITDA divided by service revenues.
- Net profit represents profit attributable to equity holders of the Company.
- In order to more objectively reflect the Company’s free cash flow, enable a comparable basis to free cash flow of prior years and avoid incomparability of free cash flow resulting from the application of IFRS 16, the original free cash flow calculation “free cash flow = EBITDA minus capital expenditure and income tax” has been changed to “free cash flow = EBITDA minus capital expenditure, income tax and depreciation charge for right-of-use assets other than land-use-rights”.
- Total indebtedness refers to interest-bearing debts excluding lease liabilities. Total equity represented equity attributable to equity holders of the Company.